JPlot
Scientific Plotting Software
Developed by Jan van der Lee ()

JPlot is a scientific plotting programme with a full graphic user interface (GUI), written in Java. The major advantage of writing this software in java is that the programme runs on any Java(2)-enabled platform, currently, at least, Linux, Solaris, MS-Windows, MacOS-X, HP and probably others as well.

JPlot accepts common ASCII datafile formats, typically in columns e.g. C1, C2, C3... Each column can be given a name, which greatly helps with selecting columns for the graph. Each X-Y couple is drawn according to specific plot-style settings, which are easily modified as shown in the screenshot to the right. One may set a point type, line colors, dash-patterns and other useful parameters allowing to obtain high quality graphs. Since version 1.1, JPlot allows to build different types of graphs such as Piper and Pourbaix diagrams (used by geochemists).

Latest version: 1.2.2 May 22, 2003

Version française Cliquez ici pour une version française

an owl I guess

  1. Screenshots
  2. Download and Run
  3. Data file formats
  4. Using JPlot from within other programs
  5. JPlot and SourceForge

Screenshots (click to enlarge)

Zircone, click to
enlarge Waves, click to
enlarge Pourbaix, click to
enlarge Piper, click to enlarge

Download and run JPlot
JPlot requires the Java 2 Runtime Environment (JRE) to be installed on your computer. The JRE (current stable release is 1.4.2) can be downloaded from http://java.sun.com/j2se. Installation of the JRE is generally very simple (e.g. launching 'setup.exe' on a MS-Windows platform). About Java 2

JPlot is available under the GPL. Here is the copyright licence of the JPlot programme.

Download a windows-only graphic installation program (setup.exe) (575054 bytes).
This is what most windows users want. It installs JPlot version 1.2.2 and creates workgroups and clickable icons in your menus. And don't worry, an 'uninstall' is provided as well ;-). However, the setup will not install the JRE for you. Do this in a separate step, before or after installing JPlot.

Download the JPlot executable jar archive version 1.2.2 (321084 bytes).
The JPlot.jar archive contains the entire JPlot package compiled in a single file. Note that you might have to press the SHIFT key while clicking on the link in order to download the file. You do not need to unpack this archive in order to run the code: simply execute the archive (java -jar JPlot.jar). For Windows and Mac users, simply double-click on the jar-file: it should be executable if the appropiate JRE is installed.

Download the sources jplot-1.2.2.tar.gz (416418 bytes).
This is a gzipped archive containing the sources as well as a simple makefile. Type make followed by make install to build the jar archive.

Sources of previous releases:

Running JPlot
Once installed, you can launch JPlot. If you created or downloaded the jar archive JPlot.jar, this file is executable under MS-Windows. Under unix/linux, the jar file is executed with the command java -jar JPlot.jar. More usually, you will wrap this command in some shell script named /usr/local/bin/jplot.

You can launch jplot with a datafile, e.g., jplot myfile.dat (see below), or with a project file, e.g., jplot -i mysettings.jpt. The latter contains all settings for a specific graph. Of course, you also can load data- and project files once JPlot is running.

Since version 1.2, JPlot proposes several other command-line options such as -s myfile.dat (show the graph immediately) and -u (update the graph automatically every second). The latter option can be toggled via one of the preference menu items.

Data files
JPlot makes graphs of data files. For example, the following set of Y1, Y2 and Y3 data is a perfectly legal format:

0.1  22  1e-4
0.2  34  1.3e-4
0.3  44  1.5e-4
0.5  51  1.6e-4
...

Loading this file in JPlot allows you to select between column 1, column 2 and column 3 for building the graph. For example, you might want to show columns 2 and 3 as a function of column 1.

It is possible to make column selection much more explicit by specifying the names of the columns in the data file. For example, the above data could also be written as follows:

# First experiment H3/LH/1002 (4 batches)
# On 12/12/1998

# column 1: weight (g)
# column 2: volume (ml)
# column 3: concentration (molal)

0.1  22  1e-4
0.2  34  1.3e-4
0.3  44  1.5e-4
0.5  51  1.6e-4
...

Loading this file in JPlot allows you to select between weight (g) , volume (ml) and concentration (molal) for building the graph, hence much more explicit and user-friendly than the anonymous columns of the previous example.

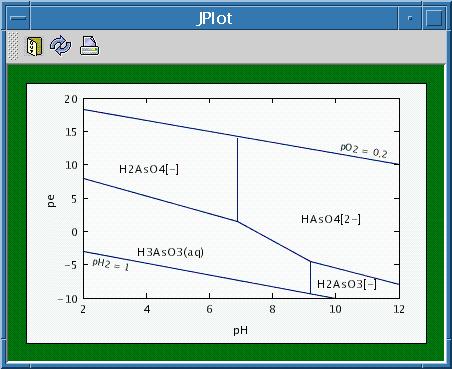
JPlot allows to add a specific character to lift the pen (*). For example, the following datafile draws a graph with straight lines defined by two couples of (X,Y) data. And note this nifty feature of JPlot: it can read labels from a datafile, i.e., the label followed by the position (x,y) and, evt., the rotation:

# This should be a 'normal' 2D graph but the special
# character '*' will lift the pen (discontinuous lines)
#
# label: "Field 1", 4, 11
# label: "Field 2", 9.5, 4.4
# label: "Field 3", 5.1, -1
# label: "Field 4", 10.4, -8
# label: "rotated label 1",10.3, 13 11
# label: "rotated label 2",3, -4 11

2    -3
10   -10   *
2     8
6.9   1.5
9.2  -4.5
12   -8    *
9.2  -4.5
9.2  -9.3  *
6.9  14
6.9   1.5  *
2    18.3 
12   10

X- and Y axes labels can be added using the xlabel and ylabel keywords, e.g. :

# label: "Field 1", 4, 11
# label: "Field 2", 9.5, 4.4
# label: "Field 3", 5.1, -1

# xlabel: "frequence (Hz)"
# ylabel: "performance (Tf)"

(data follows)
Using axes labels in datafiles is not recommended, however. At each reload of the datafile, the axes labels are added to the graph. Those who need such a feature should use the sources and write a method which update the axes labels via a resource file.

Using JPlot from within other programs
You can integrate JPlot or JPlot features in you own java program. JPlot 1.2 has been written to be used with its graphic user's interface (GUI): you have to integrate parts of the GUI in your program, such as the PlotPanels. We will upload a sample program ASAP.

Version 1.3 integrates a number of improvements which allows you to use JPlot without it's GUI. Moreover, you can use JPlot without data files. The following archive contains a simple but fully operational example illustrating of how to create a JPlot graph without it's GUI:

To install this archive, decompress, type make, followed by make run. Note: You need JPlot version 1.3 to be installed (currently only available via CVS on http://sourceforge.net/projects/jplot. A stable release of 1.3 will be made available as soon as possible.

JPlot and SourceForge
JPlot version 1.3 is currently being developed and takes several new features and enhancements into account. A development version of 1.3 is available via CVS: if you are confortable with CVS, wait a few untill we release the 1.3 via this web site.

Any useful feedback, hints or specific requests? Interested in co-developing JPlot? Check out the SourceForge web pages (click on the logo below, search for the jplot project) and contact us at jplot-users@lists.sourceforge.net

SourceForge Logo